

WASHINGTON (PAI) – Union density was 11.1 percent in 2014, the Bureau of Labor Statistics reported, down 0.2 percent from the year before. Unions added 48,000 members last year, but the workforce grew even more. The agency’s survey also showed the median weekly wage of union members was $207 more than the weekly median for non-unionists.
And unlike other female workers, union women again practically matched union men in weekly earnings. The median wage last year for union women was $905, or 89 percent of the $1,015 weekly for union men. The median for non-union women was $687, or 82 percent of the $840 weekly median for non-union men.
As in prior surveys, unionists were concentrated in the Northeast, the Great Lakes states and on the Pacific Coast, and were few and far between south of the Ohio and Potomac Rivers and – except for Minnesota, Iowa and Missouri – from the Mississippi to the Rockies.
More than half of all 14.6 million union members lived in New York, Ohio, Illinois, Pennsylvania, Michigan, New Jersey and California. New York was the most union-dense (24.6 percent) while North Carolina (1.9 percent) stayed in last place, and its density declined from 3 percent the year before. Two other Pacific states, Alaska and Hawaii were also over 20 percent unionized.
California had the most unionists, 2.5 million, up 42,000 from 2013. Then came New York (1.98 million, down 6,000), Illinois (831,000, down 20,000), Pennsylvania (701,000, up 2,000), New Jersey (635,000, up 24,000), Ohio (615,000, up 10,000) and Michigan (585,000, down 48,000). GOP-run Michigan enacted so-called “right to work” laws in late 2012, though unions are challenging them in court. Minnesota had 362,000 union members in 2014, down 2,000 from the year before, while Missouri had 214,000, down 5,000.
In all those states, except Missouri (8.7 percent), unionists were between one in every eight and one in every five workers. Besides California, big numbers jumps were in New Jersey, Oregon and Connecticut. Unions in each added 20,000+ members. Density rose by 1.7 percent in Oregon, to 15.6 percent, 1.3 percent in Connecticut, to 14.8 percent.
Thanks to labor laws which make it tough to organize private-sector workplaces, union density in public sector jobs, 35.7 percent, was more than five times the density in the private sector, 6.6 percent, BLS said. Both density numbers were virtually unchanged from 2013.
Unions had 7.358 million private sector workers and 7.218 million in the public sector. In both sectors combined, there were – again – almost 1.5 million workers whom unions represented, but who are not members.
The most-unionized occupations were local government (41.9 percent), utilities (22.3 percent), transportation and warehousing (19.6 percent), telecommunications (14.8 percent), and construction (13.9 percent). Agriculture, finance, professional services and bars and restaurants were the least-unionized. Not coincidentally, bars and restaurants are the lowest-paying occupation, in both this BLS survey and others.
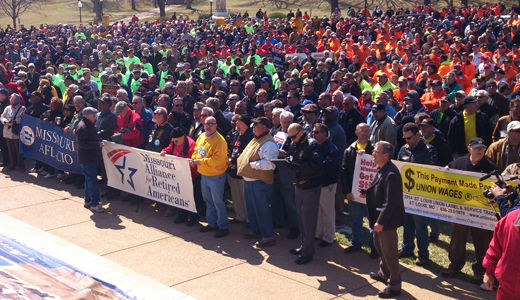
Photo: Thousands of union members and their supporters rallied against anti-worker legislation on the Capital lawn, Jefferson City, Mo., on March 26. 2014. Photography by: Tony Pecinovsky/PW Flickr
CONTRIBUTOR


Comments