
The federal minimum wage is now $7.25 per hour. If you work all year without layoff or penalty, and get a full tax refund, you will have earned $14,500.
The federal poverty level for a single individual is $11,170. For 2 people, or a pregnant woman, the federal poverty level is $15,130.
So, a couple, nevermind a family, is either suffering terribly, or tempted to indulge in outlaw, informal economies to survive,
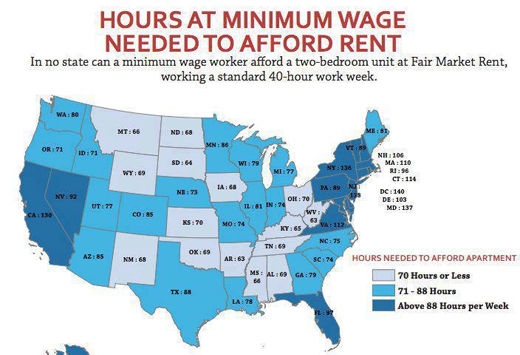
But its worse than that. Consider a recent study of housing costs measured against the minimum wage.
The Out of Reach project is a side-by-side comparison of wages and rents in every county and metropolitan area.
The report calculates the amount of money a household must earn to afford a rent at the area’s Fair Market Rent (FMR), based on an affordability standard of paying no more than 30% of income for housing costs.
From these calculations the hourly wage – also called the “housing wage” – a worker must earn to afford a two-bedroom unit is derived.
In the wake of the recent depression, with the death of Bush’s “ownership society”, more households choose renting over home ownership.
Consequently the demand for rental housing is surging, pushing “fair market rents” upward and vacancies down. For low income households and those on fixed incomes finding an affordable, decent apartment is incredibly challenging.
Here is their startling graph showing the hours at minimum wage needed to afford rent:
Of course the hours – even when calculated based on 30% of income for housing – do not capture equally dire measurements of minimum wage workers’ ability to meet the “fair market prices” of the clothing, food, education, or health care, or other services their families need.
Lets use another graph from Jared Bernstein’s blog to put the plight of minimum wage workers in a slightly broader context.
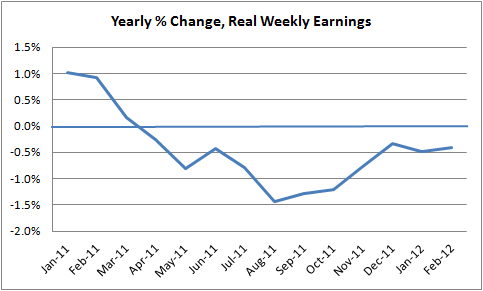
Yearly real weekly earnings changes measure if the median wage worker has more, or less, disposable income than a year ago. Disposable income does not include non-liquid kinds of benefit compensation (insurance, etc).
For most workers, “weekly” wages tells the whole story, since life is often a parable of “$5 in my pocket, and $500 I owe.”
Despite claims of economic recovery heard recently, median weekly worker income for most months of the past two years, just like most years of the past 35 years, is either flat, or less, than the year before. In other words, those of us looking at the minimum wage and housing wage graph who feel a sigh of relief that “that’s not us” may need a stronger cup of coffee: Most every month median wages and the minimum wage are getting closer!
The lesson of these graphs is a clear to me as John Donne’s famous meditation. When you hear the stories of suffering and peril that accompany ALL minimum wage families, and some pompous Faux News economist opines that raising the minimum wage will only “cost jobs”, do not ask for whom the bell tolls: It Tolls for Thee.
Photo: Creative Commons 3.0
Graph: Jared Berstien blog BLS
CONTRIBUTOR